Graphic facilitation, visual modeling and meaning
I often conceptualize visual thinking as being comprised of several distinct elements, at least from my perspective on the production side. I think of there being a dynamic component, in which we actively play with visual methods as we interact in order to make things clear which language might be obscuring. Napkin sketching, graphic recording and graphic facilitation fall in this category.
I also think of there being a static component, which is what I think of more as a visualization of some sort; some attempt to capture and synthesize a thought process, then produce a visual to represent the concept. This could be a model on a powerpoint slide, or a more elaborate and immersive visual representation, a mural, or interactive piece.
Last month I had the good fortune to work with a couple of incredibly talented scribes at the Middle East Summit of the World Economic Forum over in Jordan. What was very cool about the experience (okay, one of the many things that was cool about the experience) was that each of us was scribing in a separate room over the course of a number of days, and what I saw emerge were not just different styles of scribing, but actually different approaches to modelling conversations.
It really got me thinking, and has started to bring me to a more nuanced set of thinking about the above visual thinking categories. Under the heading of graphic facilitation/recording, what I saw last month were four sub-categories, which I’d like to explore here:
- Connective
- Categoric
- Synthetic
- Illustrative
A little caveat; I’m not saying these are the only sub-categories, only that these were three distinct approaches the three of us seemed to be taking to represent the conversations in our respective sessions. Nor are the approaches exclusive, in fact, I would argue that in a given conversation, there would likely be great benefit in employing the three. What’s of major interest to me is what the approaches mean about how to listen, and what synthesis is done as a result of the listening process.
Connective Mapping
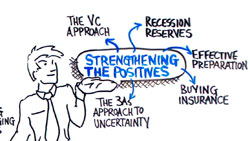
Simple connective mapping (by me)
I’ll start with the connective approach, as this represents my initial understanding of what graphic facilitation was supposed to do. This approach is very much a derivative of mind mapping; showing the connections between interrelated ideas. I find I still use this as my default, especially when trying to capture things in a hurry, as it imposes a simple and flexible taxonomy on the concepts as they come.
The approach is largely hierarchical, capturing “topics” as a central node that radiates outward into connected sub-topics. The deeper into a sub-topic the conversation goes, the more connectors will radiate out from a given node. The advantage is that you don’t really need to know where the conversation is going to capture it, and it is easy to go back and file subsequent ideas where they belong, contextually.
There are, of course, a lot of ways of doing this, but in terms of the way of listening to and interpreting a conversation, this means paying attention to the structure of the conversation, identifying the unifying concepts and drawing connections between them.
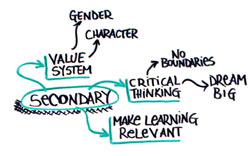
(Really) Simple connective mapping with sub nodes (by me)
Categoric Mapping
This was something that popped out at me when looking at the scribing of Sita Magnuson during the Summit. I think, from a structural perspective, categoric mapping is virtually the same as connective mapping; it is the presentation that is completely different. The organization, again, is hierarchical, in that major topics form the basis for clusters, but instead of a radiant layout, text flows into ordered categories.
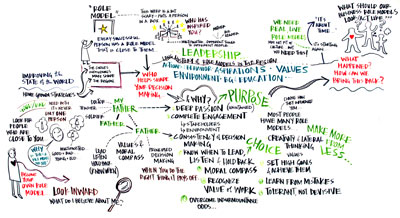
Using text layout to map categorically (Sita Magnuson)
The challenge with this approach, and why I find it very appealing, is that it requires strong skills in text layout to differentiate topic areas. As you can see in Sita’s example, different size, font and color give a sense of differentiation and emphasis. In many cases here, the text itself is used as a connector between topics.
Also evident is the mixing of styles; there is some categoric mapping, some connective mapping as well as the next kind…
Synthetic Modeling
To really conceptualize this style, it helps to take a look at some of the models that I’ve put together below which attempt to capture some of the different levels within a conversation. There is a strong connection between this approach and the previous two, in that it relates to the conversation on a structural level, but takes the approach of addressing the structure itself, showing the relationships of the various elements with each other on a conceptual level. This example is from Kelvy Bird’s scribing at the Summit.
This style was really interesting to me. It begins to make the structure of the concepts and the conversation visible, while at the same time divorcing itself from the temporal element of the interaction.
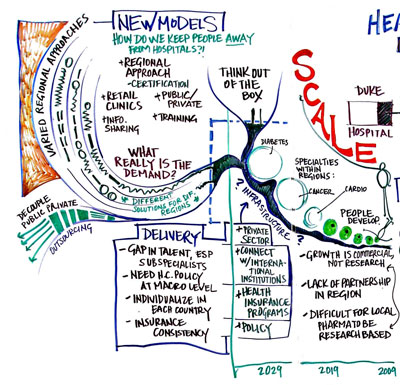
A synthetic approach to modeling a conversation (Kelvy Bird)
Illustrative Modeling
The illustrative style is the one that, predictably, gives graphic facilitation its name. This is, of course, a style that is interspersed within each of the other methods to approaching the conversation. Illustration can be a part of the structure, it can be an independent element, or it can be the structure itself. The idea of illustration, however, is to directly engage meaning. In the connective approach, for example, meaning is derived; here, the meaning is conveyed in a direct manner. This goes back to my earlier point that visuals can be employed where words are obscuring meaning.
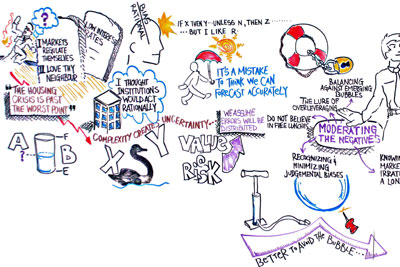
Illustrative modeling (by me)
In the example here, I’ve thrown in images that directly (I hope) trigger understanding and, by extension, better recall than could have been done with text.
This, for me, is much easier when people are having a conceptual discussion, rather than a tactical, detail oriented one. I’ve included illustrative modeling because of how it relates to some of the conclusions that have come out of this comparison for me.
A Model of Conversation
After sitting down with this and mulling it over, I found the only way I could start to make sense of it was to come up with some kind of model for conversations, listening and recording. Kelvy got me started thinking about different ways of listening, and this is my first cut at answering that. There seemed to be four elements to an interaction: flow/time, structure, meaning and concept.
Flow is quite simply a byproduct of the fact that conversations take place in time, and are thus necessarily carried out within some sequential confines. This is important, since time dictates how we are presented with information.
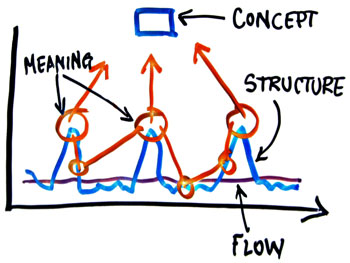
The four layers in conversation.
Structure varies based on a lot of things, not least of them the number of participants in a conversation, but also the style of presenting an idea, the contentiousness of the topics, as well as the relative emphasis or interrelatedness of various elements. Topic, sub-topic, sub-topic, new topic, important point, side note…this is the general structure of the conversation. It’s worth noting that this is separate from flow; the relationships which make up the structure do not necessarily line up in time (in fact, they rarely do…people ramble, digress, come back to points they have more to say on…).
Through all of this we assemble meaning. We pull out snippets here and there, and from this we put together our understanding of what is being said. Again, this is an independent element, which is – in part – why we can all leave the same conversation with a different understanding of what’s been said.
The concept layer, I think, is independent of meaning, though it is deeply connected. People can exchange meaning without generating a concept, but a series of related elements of meaning can begin to create something which is emergent.
I’ve sketched this out in two different models here for the purpose of getting an idea of how the various approaches map.
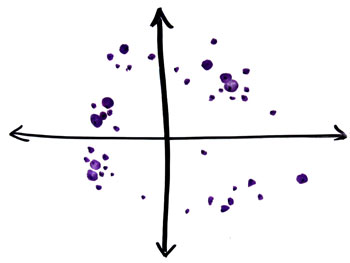
Elements of meaning plotted out in a scatter, without a time dimension.
First is the conversation itself, which I’ve drawn here as a scattershot of ideas, some bigger than others, some that are outliers and others that are clustered together. I’ve deliberately drawn this one differently from the model above to try and escape from the time dimension and focus solely on the content of the conversation. Admittedly, the two axes are meaningless. Ah well.
Your standard linear notetaking approach would look something like the line in blue, which is forced to follow the meandering path of the conversation whereever it may go in time.
The clustering or categoric approaches to listening, while still connected with the time dimension, pays most attention to correlation and clustering within the various clouds of meaning, paying attention to emphasis and affinity.
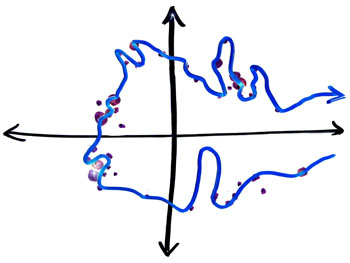
Linear notetaking following the temporal flow of the conversation. It actually probably isn't even this connected looking, now that I look at it.
The synthetic approach, I think, goes back to the original model of the layers of conversation; the ‘concept’ is separate from the structure. This separate layer, from a visual perspective, can be plotted out and used as the structure within which clustered elements can be organized.
The entire concept, for me, is very reminiscent of the old Taoist ways of representing communication and knowledge. There’s a saying about words being like the finger pointing to the moon; stare at the finger, and you’ll miss all the heavenly glory.
I would be interested to get some ideas and feedback on this (not least from Sita and Kelvy!)…how do others conceptualize ways of conversation, listening and of how to model what we hear?
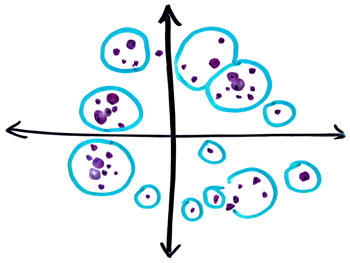
Capturing correlated pockets of meaning through the clustering approach.


2 Responses to “Graphic facilitation, visual modeling and meaning”